Abstract
In their struggle to alleviate poverty, most Sub-Sahara African governments have credited transport infrastructure development as one of the most promising development indicator to achieve this goal. In Cameroon, investment in transport infrastructure is paving the way for timely delivery of local food from rural areas to urban centers, generating employment opportunities, enhancing living standards for low-and middle-income families, and improving access to healthcare and educational facilities, while also increasing savings rates. This paper explores this transportation investments on the economic development of Bafoussam city. It focuses on three key aspects: (i) the trends in transport infrastructure development in Bafoussam, (ii) the inter-connected economic impacts of these transport developments, and (iii) recommendation for future transport investments for sustainable economic growth. Socio-Economic Growth Indicators were employed to construct a comprehensive assessment of transport infrastructure investment in the study area. To access the trends in transport development, an ex-post facto research design using time series data for 2000-2010-2020 was projected and correlated with socio-economic development indicators. Qualitative data were sourced from key informants particularly household heads (n = 147), city authorities (n = 4), and focus group discussions (n = 5), enabling a nuanced inferential analysis and interpretation of the result. The empirical data collected set the groundwork for policy recommendations aimed at promoting sustainable transport investment while fostering economic growth. The outcome of the study shows that road transport investments have significantly increased over time in Bafoussam. The findings records significant socio-economic contribution as a result of transport investment. The regression analysis of the interconnected impacts of transport investment on various socio-economic development variables indicated a perfect correlation coefficient of 1.00*, with calculated p-values of .000*. While socio-economic growth factors such as employment, income, trade, education, and healthcare facilities appear to be improving, variations exist based on location and social class within the Bafoussam urban area. This suggests the need for combined place-based and people-centered policies to effectively address the impacts of road infrastructure projects.
Keywords
Transport, Investment, Economic Growth, Infrastructure, Development
1. Introduction
The central goal of public policies designed for national and regional development envisage by many countries across the globe is to establish an environment conducive for boosting productivity, and a crucial strategy for achieving this goal is through investment in transportation infrastructure, which serves as a vital panacea for economic growth by facilitating communication, trade, and overall development
| [21] | Handy S. (2008). Regional transportation planning in the US: An examination of changes in technical aspects of the planning process in response to changing goals, Transport Policy, vol. 15, pp. 113-126. |
| [44] | Tsiotas, D., Polyzos, S., (2018). “The complexity in the study of spatial networks: an epistemological approach”, Networks and Spatial Economics, 18(1), pp. 1-32. |
[21, 44]
. On this premise, research works on the effects of transport infrastructure investment on economic output has seen significant growth worldwide. Key areas of focus include the influence of investments in roads, airports, seaports, and pipeline which are directly linked to economic growth
| [22] | Hasselgren, B., (2018). Transport Infrastructure in Time, Scope and Scale: an Economic History and Evolutionary Perspective. Springer International Publishing AG, Switzerland. |
| [23] | Heintz, J., Pollin, R., Garrett-Peltier, H., (2009). How Infrastructure Investments Support the US Economy: Employment, Productivity and Growth. Political Economy Research Institute, University of Massachussetts Amberst, Massachussetts. |
[22, 23]
, as well as their role in facilitating production and manufacturing activities across various economies
| [18] | Fourie, J., (2006). Economic infrastructure: a review of definitions, theory and empirics. S. Afr. J. Econ. 74(3), 530-556. |
| [43] | Torrisi, G., (2009). Public infrastructure: definition, classification and measurement issues. Econ. Manag. Financ. Mark. 4(3), 100-124. |
[18, 43]
. Numerous studies have however investigated the impact of transport-led economic growth
| [24] | Ive, G., Gruneberg, S. L., (2000). The Economics of the Modern Construction Sector. Macmillan, Basingstoke. |
[24]
, demonstrating the critical importance of transport infrastructure development in enhancing the economic performance of different countries
| [5] | Banerjee, A., Duflo, E., & Qian, N. (2012). On the road: Access to transportation infrastructure and economic growth in China (No. w17897). Cambridge, MA: National Bureau of Economic Research. |
| [26] | Khadaroo, J. (2015). The role of transport infrastructure in FDI: Evidence from Africa using GMM estimates (January). |
| [28] | Meersman, H., Nazemzadeh, M., (2017). The contribution of transport infrastructure to economic activity: the case of Belgium. Case Stud. Transport Pol. 5(2), 316-324. |
[5, 26, 28]
. These investigations have yielded compelling findings, indicating that transport infrastructure is a strategically vital economic sector among various forms of investment
| [33] | Pojani, D., & Stead, D. (2015). Sustainable urban transport in the developing world: beyond megacities. Sustainability, 7, 7784-7805. https://doi.org/10.3390/su7067784 |
[33]
, and serves as a foundational element for achieving inclusive growth
| [42] | Thacker, S., Adshead, D., Fay, M., Hallegatte, S., Harvey, M., Meller, H., et al., (2019). Infrastructure for sustainable development. Nature Sustainability, 2, 324-331. |
[42]
. The enhancement of transport networks alleviates production constraints and contributes to overall economic growth
| [17] | Foster, V., & Briceño-Garmendia, C. (2010). Africa's infrastructure: A time for transformation. Washington, DC: Agence Française de Développement. |
[17]
. Consequently, investment in both new construction and the improvement of existing transport infrastructure not only generates employment but also lowers transportation and input costs. Expanding transportation networks only help to foster economic stimulation through reduction in manufacturing costs and promoting global trade, industrial development, and competitiveness, thereby addressing inequalities both within and among nation states
| [11] | Damania, R., & Wheeler, D. (2018). Road improvement and deforestation in the Congo Basin Countries (World Bank Policy Research Working Paper, WPS 7274). Washington, DC: The World Bank. |
[11]
. The World Bank
highlights that developing transport infrastructure can have far reaching benefits, including reduced transportation costs, enhanced market access, and improved connectivity for workers, leading to boosted economic activity and poverty alleviation. Additionally, it also enhances access to healthcare and education facilities, resulting in improved health and education outcomes.
A good number of studies in developed countries have treated interlinkage between transportation and economic development with interesting outcome revealing different aspects of the transport infrastructures’ contributions to the local and regional development, and also showcasing the complexity and the importance of this symbiotic relationship
| [34] | Polyzos S. & Tsiotas D., (2020). The Contribution of Transport Infrastructures to the Economic and Regional Development: A Review of the Conceptual Framework. Theoretical and Empirical Researches in Urban Management, Vol. 15, Issue 1. |
[34]
. In developed countries, gigantic transport investment projects are ongoing, serving as catalysts for economic growth by enhancing connectivity, reducing travel times, and facilitating the efficient movement of goods and services. These projects not only improve access to markets but also attracts foreign direct investments, boost local economies, and create job opportunities
| [25] | Jeyaranjan, J., Harriss, J., & Nagaraj, K. (2010). Land, labour and caste politics in rural Tamil Nadu in the 20th centrury: Iruvelpattu (1916-2008). Economic & Political Weekly, 45(31). https://www.epw.in/search/site/john%20harris? |
[25]
. For instance, the expansion of high-speed rail networks in Europe is significantly increasing passenger mobility and reducing reliance on road transport, leading to lower emissions and more sustainable urban development through sustainable smart mobility
| [12] | European Economic and Social Committee and the Committee of the Regions EESC & CR, (2020). Sustainable and Smart Mobility Strategy - putting European transport on track for the future (SWD (2020) 331 final). Retrieved from EUR-Lex - 52020DC0789 - EN - EUR-Lex (europa.eu). |
[12]
. Similarly, the construction of modern ports in the United States has streamlined cargo handling, positioning the country as a key player in global trade and logistics. In Sri Lanka, the investment in highway infrastructure has led to increases in the industries’ output by more than 60%
| [20] | Gunasekera K, Anderson W and Lakshmanan T R (2008). Highway-induced development: evidence from Sri Lanka World Development 36(11) 2371-89. |
[20]
. The road construction in China, especially rural roads has raised the country’s national gross domestic product (GDP) four times higher than high-grade roads due to greater benefits than costs on the investments of rural roads
| [13] | Fan S and Chan-Kang C (2008). Regional road development, rural and urban poverty: Evidence from China Transport Policy 15 305-14. |
[13]
. In UK, the government increased its investment in transportation infrastructure to compensate for years of underinvestment in comparison with peer countries like the US, France, Canada, and Switzerland
| [32] | Pisu, M., Pels, B., Bottini, N., (2015). Improving Infrastructure in the United Kingdom. [OECD Economics Department Working Papers No. 1244. OECD Publishing. https://doi.org/10.1787/5jrxqbqc7m0p-en |
[32]
. In the survey asking users about infrastructure quality, the UK ranked 27
th in terms of overall perceived infrastructure quality, in the middle of OECD countries
. This suggests that there is plenty of room for improvement in the level and quality of the UK’s transport infrastructure.
In low-and middle-income countries, the potential for transport policies to promote sustainable and inclusive growth is substantial. This prospective is particularly pronounced in light of significant backlogs in transport infrastructure investment in both rural and urban areas, coupled with weak governance and insufficient regulations in the transport sector
| [10] | Claudia N. B., Uwe D., Yishen L., & Harris S., (2017). Transport Policies and Development. The Journal of Development Studies, Vol. 53, No. 4, 465-480, http://dx.doi.org/10.1080/002 |
[10]
. Additionally, rising social costs associated with congestion, pollution, and accidents are increasingly evident, especially in rapidly growing urban centers. For instance, transport costs in Africa, characterized by inadequate infrastructure, are significantly higher than in other regions. Specifically, the estimated transport cost between Douala in Cameroon and N’Djamena in Chad averages 11 US cents per ton-kilometer, compared to just 5 US cents per ton-kilometer in France and 4 US cents in the United States
| [41] | Teravaninthorn, S., & Raballand, G. (2008). Transport prices and costs in Africa: A review of the main international corridors. Washington, DC: World Bank. |
[41]
. Improvements in road infrastructure in South Africa, Nigeria, Ghana, Egypt as well as Algeria and Morocco have contributed to showcase these countries as economic giants in Africa
| [9] | Claudia B., Uwe D. Harris S., (2015). How roads support development. World Bank Blog. |
[9]
. While these countries present an advanced situation, others like Cameroon are making significant progress to develop it transportation sector. Though there is general tendency that no matter the level of development, crowding-out effect are common challenges witness across the urban cities no matter how developed they are.
In Cameroon, the government has made significant strides in developing the transport sector since implementing the Growth and Employment Strategy Paper (GESP) for 2010-2020. Several key projects are currently in progress across various regions, aimed at increasing government expenditure to stimulate private sector investment and drive economic growth. The development of road infrastructure is crucial for transforming different regions, influencing the spatial, economic, and social progress of the cities. More roads construction have acted as catalysts for enhancing the living standards of many unemployed Cameroonians, contributing to spatial development for some areas while causing disruption for others. Notable examples include among others the Ngaoundéré, Touboro to Moundou
| [15] | Fofiri Nzossie. (2012). Les infrastructures routières comme facteur de (re) configuration de l’espace marchands. In Cahiers de l’Afrique de l’Quest, Peuplement, marche et sécurité alimantaire, pp. 125-127. |
[15]
, Douala, Boumnyebel to Yaoundé; Yaoundé, Makenene, to Bafoussam road axis
| [8] | Caroline Dominguez, & Vivian Foster. (2011). Cameroon’s Infrastructure: A continental perspective. In Africa Infrastructure Country Diagnostic country Report (p. 59). |
[8]
, as well as Bamenda, Santa, and Babadjou road axis. However, road transport development faces significant challenges, as many towns and cities were not originally planned, leading to severe traffic congestion and delays in the delivery of goods and services
. Additionally, some residents in remote and less accessible areas continue to experience persistent poverty
| [27] | Marie, G., Boris, N., & Gael, R. (2009). The impact of roads on poverty reduction: A case study of Cameroon (p. 34). |
[27]
. Building on the insights from the background context, this research intends to explore the specific socio-economic role of transportation infrastructure development in Bafoussam City, Cameroon. By conducting field studies in key areas, we analyze how improved transportation networks affect local communities, enhance access to jobs and services, and influence living standards of residents. The research provides a nuanced understanding of the interplay between transport investment and regional economic growth, ultimately offering recommendations for optimizing future transport initiatives in Bafoussam and similar urban areas.
2. Theoretical Construct
Transport Infrastructure Growth Model
The Transport Infrastructure Growth Model (TIGM) posits that investments in transportation infrastructure such as roads, railways, airports, and public transit systems are fundamental drivers of economic growth and regional development. This model operates on the premise that enhanced transport networks can significantly improve the movement of goods and people, leading to increased economic activity, better accessibility, and an overall enhancement in the quality of life within communities. The nexus between transport infrastructure and economic growth has been a focal point of research and policy discussions for decades
| [40] | Sharma, Keshab K., Netra P. B., Mandip S., and Rojee P., (2024). Unraveling the Nexus between Road Transport Infrastructures and Economic Growth: Empirical Insights from Nepal’s Case. Economies 12: 221. https://doi.org/10.3390/economies12080221 |
[40]
. As societies evolve, the demand for efficient transportation systems becomes increasingly critical, serving as a catalyst for regional development and social progress.
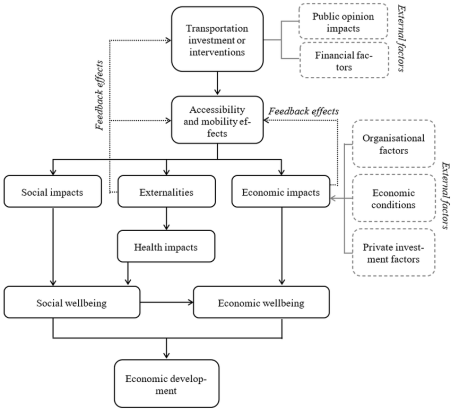
The Transport Infrastructure Growth Model (TIGM) as seen on
Figure 1, provides a comprehensive framework for understanding how investment in transportation networks such as roads, railways, airports, and public transit stimulates economic activities, improve accessibility, and enhance the overall quality of life for communities
. Transport infrastructure is considered essential for increasing economic progress, pillar to economic growth both directly and indirectly
| [4] | Arvin, M. B.; Pradhan, R. P.; Norman, N. R., (2015). Transportation intensity, urbanization, economic growth, and CO2 emissions in the g-20 countries. Util. Policy, 35, 50-66. |
| [35] | Pradhan, R. P.; Bagchi, T. P., (2013). Effect of transportation infrastructure on economic growth in India: The VECM approach. Res. Transp. Econ., 38, 139-148. |
[4, 35]
. Historically, the development of transport infrastructure has been linked to the economic prosperity of regions. In the early 20th century, the expansion of rail networks in Europe and North America facilitated the movement of goods and people, leading to industrial growth and urbanization
| [19] | Gillen, W., (2009). What are the “ingredients” for economic growth? New York: Seabury Press. |
[19]
. New Zealand’s early economic development witnessed transition from a rudimentary, fragmented transport system to even a poorly-developed network which was of great importance. As time evolved, technological progress in transport, and the consequent capital investment, was essential to New Zealand's early economic development
| [14] | Francois, T., (2005). Institutions and systems: Analysing technical innovation processes from an institutional perspective, pp. 23-48. |
[14]
.
At the core of the TIGM, lies several key components. First, investment is crucial; both public and private funding are needed to develop and maintain efficient transportation systems. Second, improved accessibility is a direct outcome of enhanced infrastructure, allowing communities to connect to markets, educational institutions, healthcare facilities, and job opportunities. This accessibility fosters increased economic activity by lowering logistics costs and enabling businesses to operate more efficiently
| [31] | OECD (2002). Impact of Transport Infrastructure Investment on Regional Development. Organisation For Economic Co-Operation and Development, https://www.itf-oecd.org |
[31]
. Moreover, the model highlights the social benefits derived from transport infrastructure. Improved networks contribute to social equity by linking underserved populations to essential services and economic opportunities, which helps reduce regional disparities. The model advocates for sustainability in transport investments, stress the importance of minimizing environmental impacts while achieving economic objectives.
Despite the importance of the model in transport-led-development initiatives, it has faced several criticisms, particularly regarding its assumptions and implications for sustainable development. One significant concern is the fact that the model rely on the notion that expanding transport infrastructure automatically leads to economic growth. Critics argue that this model oversimplifies the relationship between transport and economic productivity. For example, in regions experiencing heavy investment in roads, especially in some countries of sub-Saharan Africa, the expected economic uplift has not always materialized, leading to questions about the model's efficacy. The TIGM often overlooks the environmental consequences of infrastructure expansion. For example, increased transport capacity can lead to higher greenhouse gas emissions and contribute to climate change, particularly in urban areas. A case in point is the expansion of highway systems in the United States, which has correlated with increased vehicle usage and consequent environmental degradation, and emissions, contradicting sustainability goals
| [47] | Yu, Haowei and Zhou, (2021). You, Highway Spending and Induced Vehicle Emissions: Evidence from the US States. Resource and Energy Economics, Forthcoming, Available at SSRN: http://dx.doi.org/10.2139/ssrn.3763248 |
[47]
.
Figure 1. Transportation infrastructure growth model.
Another criticism revolves around social equity. The model tends to prioritize infrastructure projects that benefit certain economic activities, often neglecting marginalized communities
. For instance, in cities like São Paulo, massive transport projects have disproportionately favored wealthier neighborhoods, exacerbating existing inequalities
| [7] | Boisjoly, G., Serra, B., Oliveira, G., & El-Geneidy, A. (2020). Inequity in transit: Evaluating public transport distribution through accessibility measurements in São Paulo, Rio de Janeiro, Curitiba and Recife, Brazil. Journal of Transport Geography, 82, 1-11. |
[7]
.
This model specification is strongly supported by Pravakar
| [36] | Pravakar S., Ranjan K. D., and Geethanjali N., (2010). Infrastructure Development and Economic Growth in China. Institute of Developing Economies, JETRO. |
[36]
, who argues that investment in transport infrastructure fosters the establishment of production facilities and stimulates economic activities. This, in turn, reduces transaction and trade costs, enhances competitiveness, and generates employment opportunities. Conversely, insufficient infrastructure can create bottlenecks that hinder sustainable growth and impede poverty reduction efforts. Infrastructure constitutes the essential amenities and social capital of a nation, enabling both economic and social activities. Key types of infrastructure investment include transportation systems, public health and education services, and community facilities, such as railways, airports, hospitals, schools, roads, sewage systems, and reservoirs
| [39] | Sedar, F. P. (2007) Infrastructure and Economic Growth: The Role of Infrastructure for Economic Growth in Africa: Case Study of Cote d’ Ivoire. Research paper for GECO 6203: Advance Macroeconomics ll. New School University, New School for Social Research. New York. |
[39]
. These elements are vital for facilitating connectivity and improving the quality of life for citizens.
In contemporary contexts, particularly in developing regions like Cameroon, transport infrastructure investments have intensify socio-economic progress. The transport sector is a key link to the Cameroonian economy and an essential support to the country’s accelerated growth strategy, particularly through its significant support to the implementation of productive sectors strategies (agriculture and rural development, mines, industry, housing development, trade). In keeping with the medium and long-term thrusts defined in the Growth and Employment Strategy Paper (GESP) of the country, the government undertook to scale up the share of the paved road network from 10% in 2010, to 17 % by 2020 which witnessed a significant progress in the country’s Gross Domestic Product (GDP),
| [1] | ADBGC-African Development Bank Group of Cameroon, (2018). Transport Sector Support Programme Phase III- Construction of the Ring Road. Summary of the Resettlement Action Plan for Project Affected Persons. |
[1]
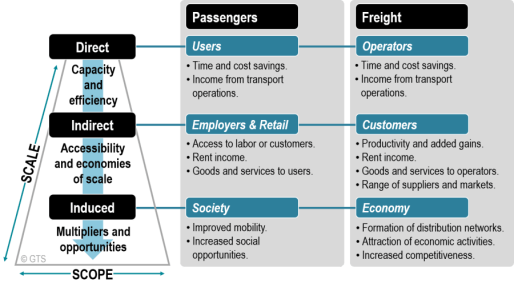
. In the Cameroon cities such as that of Bafoussam, where agriculture, trade and small-scale industries form the backbone of the economy, transportation investment have induced, direct and indirect impacts to the society, employers and urban transport users (
Figure 2).
The Transport Infrastructure Growth Model posits that strategic investments in transport not only enhance connectivity but also attract investments, create jobs, and stimulate economic diversification. Moreover, the model recognizes the multifaceted benefits of transport infrastructure investment beyond mere economic growth. Improved transportation leads to better access to education and healthcare, fostering social equity and inclusion. It helps integrate remote areas into the broader economic framework, reducing disparities and promoting regional cohesion.
Figure 2. Framework for the socio-economic impact of transport investment.
3. Materials and Methods
The town of Bafoussam is the capital and largest city of the West Region of Cameroon, in the Bamboutos Mountains. It is located between latitudes 5°26’ and 5°30’ North and longitudes 10°20’ and 10°30’ East. It is bounded to the North West by the Bamboutous and Menoua divisions, to the south west by the Menoua high Plateaux and the Koung-khi divisions, the north-east by the Bamboutous (
Figure 3).
Figure 3. Location map of Bafoussam in the West region of Cameroon.
In this study, we examine the effects of transport infrastructure investments on the economic growth of Bafoussam city. An ex-post facto research design was deemed the most appropriate method for analyzing the time series data related to transport investments in Bafoussam from 2000 to 2020, enabling the accurate estimation of the model employed. To enhance the value of the time series data, secondary data were obtained from the Council Development Plan (CDP) of Bafoussam for 2020. The inferential statistics applied in this study are grounded in neoclassical and endogenous growth theories. These frameworks provide details of the anticipated impacts of transport infrastructure investments on economic growth. Recently, these theories have gained prominence in discussions on regional development, particularly concerning public capital investments, as highlighted in the works of Aschauer
| [3] | Aschauer, D. A., (1989). Is public expenditure productive? J. Monetary Econ. 23(2), 177-200. |
[3]
, Munnell
| [30] | Munnell, A. H., (1992). Policy watch: infrastructure investment and economic growth. J. Econ. Perspect. 6(4), 189-198. |
[30]
, and Barro
| [6] | Barro, R. J. (1988). "Government Spending In a Simple Model Of Endogenous Growth." National Bureau of Economic Research Working Paper No. 2588. |
[6]
.
To explain the relation between investment and economic growth, we incorporating production function framework in to the neoclassical growth model and factors of production were captured by the general Cobb-Douglas function
| [37] | Sahoo, Pravakar, and Ranjan Kumar Dash., (2012). Economic Growth in South Asia: Role of Infrastructure. The Journal of International Trade & Economic Development 21: 217-52. |
[37]
.
The neoclassical and the endogenous growth model is expressed in the following equation:
Ti=µ (A, K, L) EInfrastructure(1)
Where Ti = Transport investments, depends on K = Level of capital, L = Labour force, and E= level of expenditure on infrastructure.
Note that, K and L are interaction variables that relate road transport infrastructure investments to economic growth, and as interaction variables, they are assumed to be constant. We then replace µ in the function above with x and adjust the independent variables accordingly to form a multiple linear regression model expressed as:
Ti= SED = X0+ X1 GTRI + X3 AGSD + S4INSD + X5HOSD + X6EDUSD + X7MAC …….(2)
Letting Ti = Transport Investments
SEG = Socio-Economic Development
X1 = Growth in Transport Infrastructure
X2 = Gross Domestic Products
X3 = Agricultural Sector Development
X4 = Industrial Sector Development
X5 = Health Sector Development
X6 = Education Sector Development
X7= Market Accessibility
Note that µ, α, β, ℇ, ϭ, ∂, φ represent parameters associated with economic growth. The Cobb-Douglas production function is recognized for its non-linear relationship between inputs and outputs. To facilitate the analysis, we transform the variables into their logarithmic form as in Equation 5. Consequently, we estimate the economic growth relationship as follows:
Ti=A+αLnX1+βLnX2+ƹLnX3+ƶLnX4+ϭLnX5+ Z ….=(3)
Where Z = Stochastic error term,
The a-priori expectations are:
Α>0, β>0, ƹ>0, ƶ>0, ∂>0,Ⴔ>0
To fulfill the objective of the study, equation (
3) is transformed in to natural log form:
InGDPʈ=a0+β1InX1+β2InX2+β3InX3+β4InX4+β5InX5+uʈ(4)
With expected sign of estimators as:
β 1,2,3, β4, β5, β6>0
The calculated P-value for the analysis was ruled at
P<0.01,** p<0.05,* p<0.1 to be positively significant.
4. Results and Discussion
4.1. Trends in Transport Infrastructure Investments in Bafoussam
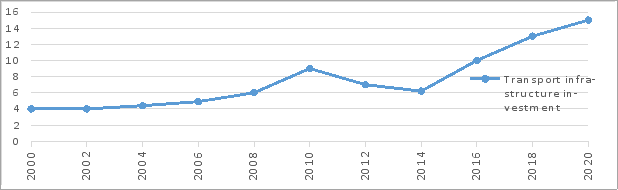
The trend in transport infrastructure investment in Bafoussam is presented using the line graph as shown in
Figure 4. Since the year 2000, there has been progression in the growth of transport infrastructure investment, though at a slow pace from 2000-2010. Infrastructures really got at deplorable stage from 2010-2014, with most of the access roads inaccessible for vehicles. But as from 2015 with the implantation of the Transport Sector Support Programme (PHASE-2) and cognizant of the crucial role that quality infrastructure play in driving trade and promoting robust and sustainable economic growth, the Government of Cameroon embarked to invest heavily in infrastructure during the implementation of the Growth and Employment Strategy program. Within the frame of this program, Bafoussam city witnessed increase transport infrastructure investment. It is evident from the trend analysis graph, as seen from 2015-2020, over the entire period there has been significant increase in transport infrastructure investment.
Figure 4. Transport infrastructure investment in Bafoussm city.
4.2. Evolution of Road Transport in Bafoussam (2000-2020)
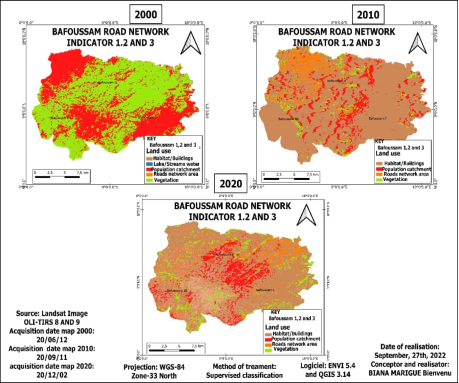
As illustrated in
Figure 5, the road network in Bafoussam in 2000 occupied an estimated area of 2,100 hectares, while built-up surfaces covered approximately 10,000 hectares. The catchment areas utilized by the population were estimated at 14,010 hectares, with vegetation occupying 14,900 hectares and aquatic features, including lakes and streams, covering 310 hectares. In total, the land-use areas in 2000 amounted to 41,320 hectares, comprising five distinct elements (2,100 ha + 10,000 ha + 14,010 ha + 14,900 ha + 310 ha = 41,320 ha).
By 2010, significant changes in land use were observed. The area occupied by roads increased to 3,080 hectares, while built-up areas expanded to 17,320 hectares. However, there was a notable decline in the population catchment areas, which reduced to 8,022 hectares, indicating a retreat from these zones. Concurrently, vegetation areas experienced a substantial reduction, decreasing to 2,312 hectares. Prominent attribute to this decline is urban sprawling, which have led to the conversion of green spaces for development, reflecting trends in rapid urbanization in Bafoussam.
Between 2015 and 2020, Bafoussam experienced remarkable transformations in road infrastructure. During this period, extensive road construction projects were initiated, facilitating access to various neighborhoods and attracting economic investments, which further spurred the growth of built-up areas.
Figure 5. Evolution of land uses in Bafoussam.
By 2020, the total surface area occupied by roads had increased to 11,080 hectares, with built-up surfaces expanding to 31,000 hectares. The population within catchment areas was estimated at 7,010 hectares, while total vegetation in the city was reduced to 1,030 hectares. Notably, the introduction of inter-district roads accounted for an additional 2,200 hectares, enhancing connectivity and potentially contributing to the region's economic development. These changes in land use highlight the dynamic relationship between urban growth and transportation infrastructure, underscoring the need for sustainable planning to balance development with environmental conservation.
Table 1 presents the land use data utilized to generate the maps. Cartographic data were acquired from various sources to create these maps, particularly the road map of Bafoussam. We employed geographic data to produce both digital and graphic representations. This process was supported by remote sensing technologies, including satellite and aerial imagery, which provided critical information on population density and demographic characteristics. The table summarizes the statistical data reflecting the evolution of road transport in the years 2000, 2010, and 2020. The image sensor OLI-TIRS has a resolution of 30 meters, with acquisition dates for the maps as follows: 2000 - June 20, 2000; 2010 - September 20, 2011; and 2020 - December 20, 2020. The maps were created on October 27, 2022, by the operator SRTM, using projections based on WGS-84 UTM Zone 33 and USGS sources. Statistical data included calculations based on the occupied areas of the municipalities of Bafoussam 1, 2, and 3.
Table 1. Land use data utilized for the maps.
| Remote sensing date used for the study |
SN | PLATFORM | CAPTOR/ SENSOR | RESOLUTION CEL SIZE/m | ACQUISITION | REALISATION DATE | OPERATOR | PROJECTOR | SOURCE IMAGE |
1 | Landsat_8 and 9 | OLI-TIRS | 30 m | Map of 2000: 20/06/20 Map of 2010: 20/09/11 Map of 2020: 20/12/02 | 27/10/2022 | SRTM | WGS-84 UTM Zone- 33 | USGS |
| Changes in the Evolution of Land Use Statistics in Bafoussam (hectares). |
LAND USE | 2000(ha) | 2010(ha) | 2020(ha) | Total | COLORS | |
Road network | 2 100 ha | 3 080 ha | 11 080 ha | 16 260 | |
Habitat/Buildings | 10 000 ha | 17 320 ha | 31 000 ha | 58 320 | |
Population catchment areas | 14 010 ha | 8 022 ha | 7 010 ha | 29 042 | |
Vegetation | 14 900 ha | 2312 ha | 1 030 ha | 18242 | |
Lake/streams | 310 ha | | | 310 | |
Inter District road | | | 2 200 ha | 2 200 | |
TOTAL in ha | 41 320 ha | 30,734 ha | 52, 320 ha | 124,374 | |
Source: Authors realization
4.3. Socio-economic Contribution of Transport Investment in Bafoussm
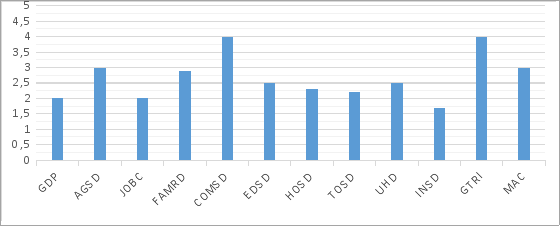
Figure 6 illustrates the substantial impact of transport infrastructure investment on various economic growth indicators in Bafoussam. The evaluation was conducted on a Likert scale of 0 (zero) to 5 (five), ranging from least to strongest impact. Notably, the commercial sector development (COMSD) and the growth in transport infrastructure (GTRI) yielded the most significant socio-economic benefits among all evaluated impacts of transport investment. Additionally, sectors such as agriculture (AGSD), farm road development (FAMD), and market access (MAC) have also played critical roles in fostering economic growth in the region.
Furthermore, investments in transport infrastructure have led to notable enhancements in education (EDSD), healthcare services (HOSD), urban housing (UHD), tourism development (TOSD), Gross Domestic Product (GDP), and job creation (JOBC). These improvements underscore the multifaceted benefits of such investments, demonstrating their capacity to elevate living standards and stimulate local economies. Particularly noteworthy is the rapid development of the industrial sector (INSD), which has emerged as a vital component of Bafoussam’s economic landscape. This shift reflects a broader trend where transport investment not only facilitates the movement of goods and services but also catalyzes industrial growth, thereby contributing to a more diversified and resilient economy.
Figure 6. Socio-economic contribution of transport investments in Bafoussam.
Note: GDP= Gross Domestic Product, AGSD= Agricultural Sector Development, JOBC= Job Creation, FAMR= Improve Accessibility, COMSD= Commercial Sector Development, EDSD= Educational Sector Development, HOSD= Health Sector Development, UHD= Urban Housing Development, INSD= Industrial Sector Development, GTRI= Growth in Transport Infrastructure, MAC= Market Accessibility
4.4. Inferential Analysis of Transport Investment on Economic Growth
The Cobb-Douglas production function was consider the best tool to use for the analysis as described on
Table 2. We used the Jarque-Bera test of normality for the descriptive evaluation of the data and to establish the nature of the distribution. We consider transport investment (Ti) as dependent variable, while the socio-economic variables generated as a result of the Ti forms the independent variables. The calculated p-value was placed at 0.000 or 0.001 at 95% significance level.
The result of the descriptive analysis of the data showed that the mean and median of all the variables in the data set lie within the maximum and minimum values. All the variables are positively skewed and highly symmetrical since their means are greater than their medians and skewness coefficient is greater than one. The positive values of the kurtosis of all the variables established the fact that these variables are leptokurtic in nature. The values of the Jarque-Bera statistic show that real GDP, agriculture sector development AGSD, job creation JOBC, farm road development FAMRD, commercial sector development COMSD, education sector development EDSD, health sector development HOSD, tourism sector development TOSD, urban housing development UHD, industrial sector development INSD, and growth in transport infrastructure GTRI, are normally distributed since their p-values are statistically significance at .000** to .005. Hence, the result shows that all the variables are statistically significant. Thus, the result indicates that transport investment in Bafoussam have significant positive impact on socio-economic development.
Table 2. Inferential statistics of socio-economic development of Bafoussam.
Variable | Mean | Median | Maxi. | Mini. | Std. Dev. | Jarque-Bera | Skewness | Kurtosis | Sig. |
GDP | 542551.022 | 32060982. | 2533752. | 1377925. | 6.0214 | 5.07203 | 0.37558 | 5.5914 | .002 |
AGSD | 965995.163 | 82400732 | 984336.5 | 5264881. | 19.170 | 6.81677 | 0.30244 | 7.0289 | .000** |
JOBC | 660672.062 | 4523708.5 | 40028.00 | 39310.94 | 3.2798 | 4.26246 | 0.55872 | 3.8548 | .005 |
FAMRD | 641353.389 | 4390461.1 | 5595222. | 410657.6 | 5.2887 | 5.73658 | 0.24955 | 3.0502 | .002 |
COMSD | 666036.768 | 536011.20 | 9623930 | 7303505. | 1.9364 | 3.26486 | 0.15820 | 8.5285 | .000** |
EDSD | 502272.256 | 35030432. | 4498707. | 342254.8 | 29.460 | 12.4759 | 1.04285 | 4.8141 | .035 |
HOSD | 651664.065 | 412003.32 | 482326.6 | 370455.6 | 4.2375 | 15.3281 | 1.09589 | 3.4682 | .049 |
TOSD | 550905.815 | 4523708.5 | 40134.03 | 3305507. | 5.6385 | 5.24272 | 0.57535 | 2.5952 | .053 |
UHD | 520905.512 | 2330431.1 | 3545132. | 252452.9 | 4.3752 | 4.53635 | 0.35475 | 4.0599 | .005 |
INSD | 750605.513 | 524022.20 | 5021912. | 3814536. | 3.0046 | 3.42658 | 0.57200 | 4.8064 | .001* |
GTRI | 790105.817 | 53130235. | 90028.00 | 41422.60 | 3.5721 | 5.63816 | 0.45083 | 6.7115 | .001* |
MAC | 852605.015 | 614105.35 | 7379124 | 54183.03 | 5.0303 | 6.20600 | 0.28049 | 5.8673 | .000** |
Total observation = 147 Calculated P-value = <0.01,** p<0.05,* p<0.1 Df1 = 1 a. Independent Variable (constant) = Ti b. dependent variables = SED |
Source: Authors Computation
4.5. Inter-connected Economic Impacts of Transport Developments
We conducted regression analysis to explore the interconnected impacts of transport investment on various socio-economic development variables. The results from the pairwise correlation analysis indicate a perfect correlation coefficient of 1.00*, with calculated p-values of .000, as shown in
Table 3. This signifies that all examined variables are correlated at a .000 level of significance, indicating a strong interdependence among them. The coefficient of determination (R-squared) ranges from a lower boundary of .819 to an upper boundary of .997. This indicates that between 81.9% and 99.7% of the variation in transport investment (Ti) is explained by the variation in socio-economic development (SED). Such a high level of explained variance suggests a robust relationship between these two constructs. In practical terms, this implies that as transport investment continues to increase or improve, corresponding enhancements in socio-economic development variables are likely to occur. For instance, improvements in transport infrastructure lead to increased market access, enhanced productivity in agriculture and industry, and overall economic growth of Bafoussam.
Table 3. Regression analysis.
Pairwise Correlation coefficient of the dependent and independent variables |
| Ti* | SED* | GDP | AGSD | JOBC | FAMRD | COMSD | EDSD | HOSD | TOSD | UHD | INSD | INSD | MAC |
Correlation Coefficient | SED* | 1.00* | .995 | .982 | .891 | .958 | .992 | .984 | .873 | .899 | .889 | .979 | .994 | .988 |
GDP | .975 | 1.00* | .931 | .992 | .960 | .978 | .940 | .978 | .937 | .971 | .960 | .995 | .899 |
AGSD | .982 | 931 | 1.00* | .925 | .915 | .856 | .997* | .995 | .990 | .992 | .984 | .937 | .956 |
JOBC | .891 | .992 | .925 | 1.00* | .983 | .971 | .884 | .933 | .873 | .869 | .969 | .964 | .918 |
FAMRD | .958 | .960 | .915 | 983 | 1.00* | .931 | .986 | .948 | .985 | .969 | .996 | .971 | .980 |
COMSD | .992 | .978 | .856 | .971 | .931 | 1.00* | .940 | .983 | .9978 | .996 | .994 | .996 | .987 |
EDSD | .984 | .940 | .997* | .884 | .986 | .940 | 1.00* | .913 | .849 | .939 | .819* | .914 | .918 |
HOSD | .873 | .978 | .995 | .933 | .948 | .983 | .913 | 1.00* | .952 | .860 | .878 | .980 | .918 |
TOSD | .899 | .937 | .990 | .873 | .985 | .997* | .849 | .952 | 1.00* | .871 | .809 | .829 | .977 |
UHD | .889 | .971 | .992 | .869 | .969 | .996 | .939 | .860 | .871 | 1.00* | .838 | .973 | .974 |
INSD | .979 | .960 | .984 | .969 | .996 | .994 | .819* | .878 | .809 | .838 | 1.00* | .968 | .977 |
GTRI | .994 | .995 | .937 | .964 | .971 | .996 | .914 | .980 | .829 | .973 | .968 | 1.00* | .985 |
Sig. (2-tailed) | MAC | .988 | .899 | .956 | .918 | .980 | .987 | .918 | .918 | .977 | .974 | .977 | .985 | 1.00* |
| . | .000 | .000 | .000 | .000 | .000 | .000 | .000 | .000 | .000 | .000 | .000 | .000 |
| | . | .000 | .000 | .000 | .000 | .000 | .000 | .000 | .000 | .000 | .000 | .000 |
| | | . | .000 | .000 | .000 | .000 | .000 | .000 | .000 | .000 | .000 | .000 |
| | | | . | .000 | .000 | .000 | .000 | .000 | .000 | .000 | .000 | .000 |
| | | | | . | .000 | .000 | .000 | .000 | .000 | .000 | .000 | .000 |
| | | | | | . | .000 | .000 | .000 | .000 | .000 | .000 | .000 |
| | | | | | | . | .000 | .000 | .000 | .000 | .000 | .000 |
| | | | | | | | . | .000 | .000 | .000 | .000 | .000 |
| | | | | | | | | . | .000 | .000 | .000 | .000 |
| | | | | | | | | | . | .000 | .000 | .000 |
| | | | | | | | | | | . | .000 | .000 |
| | | | | | | | | | | | | . | .000 |
Total observation = 147 Calculated P-value = <0.01,** p<0.05,* p<0.1, (Sig. =.000) a. Independent Variable (constant) = Ti, |
Source: Authors Computation
5. Discussion of Findings
The discussion is done in line with the objectives of the paper, corroborating similar results from scholarly works. As seen on the findings of the first objective, the transport infrastructure investment trends in Bafoussam have evolved significantly, particularly following the implementation of the strategic programs aimed at enhancing socio-economic growth. From 2000 to 2010, investment growth was sluggish, peaking at a critical low from 2010 to 2014 when many access roads became impassable. This decline was reversed in 2015 with the launch of the Transport Sector Support Programme (PHASE-2), which catalyzed a renewed focus on infrastructure development. The subsequent years, especially from 2015 to 2020, witnessed a marked increase in investments, aligning with the government's Growth and Employment Strategy program (DCSCE). This revival in transport investment have had a multifaceted impact in sectors such as agriculture, commerce, job creation, education, health, tourism and industrial development have benefitted significantly, with the commercial sector emerging as a key driver of economic growth of the Bafoussam region.
The results of this objective is parallel to the assertion by Handy
| [21] | Handy S. (2008). Regional transportation planning in the US: An examination of changes in technical aspects of the planning process in response to changing goals, Transport Policy, vol. 15, pp. 113-126. |
[21]
and Tsiotas & Polyzos
| [44] | Tsiotas, D., Polyzos, S., (2018). “The complexity in the study of spatial networks: an epistemological approach”, Networks and Spatial Economics, 18(1), pp. 1-32. |
[44]
who opined that effective public policies aimed at enhancing productivity are fundamentally linked to transportation infrastructure investment. The investment surge in Bafoussam can be seen as a strategic response to the identified necessity for quality infrastructure, which is critical for facilitating trade, agriculture, health, education, road access and communication. The reports of deteriorating infrastructure from 2010 to 2014 in the study area resonate with findings from Mehmood Alam
| [29] | Mehmood Alam, K. (2017). Efficiency evaluation of Pakistan Railways using data envelopment analysis. Civil and Environmental Research, 9(4). |
[29]
and Pojani & Stead
| [33] | Pojani, D., & Stead, D. (2015). Sustainable urban transport in the developing world: beyond megacities. Sustainability, 7, 7784-7805. https://doi.org/10.3390/su7067784 |
[33]
, who emphasize that inadequate transport networks impose constraints on production and economic performance. The implementation of the Transport Sector Support Programme and the Growth and Employment Strategy indicates a conscious effort by the Cameroon government to rectify these issues, reflecting the literature’s consensus on the necessity of targeted investment in transport to alleviate economic bottlenecks. The significant increase in transport infrastructure investments from 2015 to 2020 accords with findings from the World Bank
, stressing that improved infrastructure leads to enhanced market access and connectivity, ultimately boosting economic activity and reducing poverty. Such investments not only aid in reducing transportation costs but also create employment opportunities and stimulate local economies, which is consistent with the observed trends in Bafoussam.
The results of the second objective, based on the Jarque-Bera normality test, indicated that all socio-economic development (SED) variables are normally distributed. The study revealed that all variables became stationary at the first difference, and regression analysis demonstrated a significantly positive impact of transport infrastructure investment on these variables. Further examination of socio-economic growth across various sectors showed that investment in transport infrastructure had the most substantial effect on GDP, with a correlation of R =.975 and a p-value of .001. Significant growth was also observed in the Agricultural Sector Development (AGSD), with R =.982 and a p-value of .001, as well as increases in job creation (JOBC) with R =.891, farm road development (FAMRD) with R =.958, and commercial sector development (COMSD) with R =.992, all having a p-value of .001. Additionally, educational sector development (EDSD) recorded R =.984, housing sector development (HOSD) had R =.873, transport sector development (TOSD) stood at R =.899, urban housing development (UHD) was R =.889, industrial sector development (INSD) reached R =.979, and growth in trade and investment (GTRI) was R =.994, along with a p-value of .001 for each. All of these socio-economic indicators exhibited a significantly positive effect on the economic growth of Bafoussam, with a 95% level of significance. The application of the Cobb-Douglas production function supports the assertion that transport investment (Ti) serves as a crucial driver for socio-economic growth, echoing findings from Heintz et al.,
| [23] | Heintz, J., Pollin, R., Garrett-Peltier, H., (2009). How Infrastructure Investments Support the US Economy: Employment, Productivity and Growth. Political Economy Research Institute, University of Massachussetts Amberst, Massachussetts. |
[23]
that underscore the link between infrastructure and economic output. The positive skewness and leptokurtic nature of the variables in the analysis suggest that the benefits derived from transport investments in Bafoussam are not only statistically significant but also have a substantial impact on sectors like agriculture, commerce, and education. The insights from Gunasekera et al.,
| [20] | Gunasekera K, Anderson W and Lakshmanan T R (2008). Highway-induced development: evidence from Sri Lanka World Development 36(11) 2371-89. |
[20]
regarding Sri Lanka, and Fan & Chan-Kang
| [13] | Fan S and Chan-Kang C (2008). Regional road development, rural and urban poverty: Evidence from China Transport Policy 15 305-14. |
[13]
about China's rural roads exemplify how targeted transport investments can elevate industrial output and GDP, which mirrors the improvements in Bafoussam's socio-economic landscape. The statistical significance of variables like job creation and urban housing development reinforces the argument made by Thacker et al.,
| [42] | Thacker, S., Adshead, D., Fay, M., Hallegatte, S., Harvey, M., Meller, H., et al., (2019). Infrastructure for sustainable development. Nature Sustainability, 2, 324-331. |
[42]
on the importance of transport infrastructure in achieving inclusive growth. The findings however, reflect a broader consensus among researchers that transport infrastructure is integral to economic advancement and social welfare, particularly in rapidly developing regions where appropriate investments can significantly alleviate logistical constraints and stimulate local economies.
6. Recommendations for Future Transport Investments in Bafoussam
Though, transport investment in the past half a decade have revitalized the socio-economic sector in Bafoussam, at this point it is important to start reflecting on future transport policies given the current accelerated rated of urbanization in the city. There is need to consider environmental sustainability and governance issues to be able to mitigate congestion and pollution that is already at its peak as a result of increase motorization. Thus, the insights gained from this study can guide policymakers in making informed decisions to maximize the long-term impacts of transport investments on Bafoussam’s economic landscape. The following recommendations are therefore, envisaged for city authorities to take action.
1) City authorities in Bafoussam should consider investing in reliable and efficient public transport systems, such as buses and commuter trains. This can help reduce traffic congestion and provide affordable mobility for residents. Transit-oriented development and car-free zones can also significantly reduce reliance on private vehicles in the city and enhance safety mobility and environmental sustainability.
2) While we do appreciate the transport development in Bafoussam city, the government is encouraged to ensuring effective interconnection of remote areas. This includes embracing and interconnecting the rural communities and centers to ensure that all of the regional transportation issues are vigilantly considered.
3) City planners in Bafoussam are urged to invest in compact, mixed land-use neighborhoods development. This is very significant in reducing long-distance travels within the city and encouraging walking, cycling and public transit usage. Implementing pedestrian-friendly streets, dedicated bike lanes and efficient public transportation networks could make sustainable transport options in the city more accessible and appealing.
4) Investment in road transport through allocation of funds for regular maintenance and rehabilitation of existing infrastructure to prolong its lifespan, enhance safety standards, and ensure optimal performance over time is timing as a pro-active measures for sustainable transportation in Bafoussam.
7. Conclusion
The study investigate the role of transport investment in driving socio-economic development in Bafoussam. The analysis demonstrates that trends in transport investments have passed through daunting periods since the year 2000, ranging from sluggish stage (2000 -2010), hitting a lowest level from 2010 to 2014. But with the adoption of the Transport Sector Support Programme (PHASE-2), the transport sector witnessed increased investments from 2015 to 2020 with adversed positive effects on agriculture, commerce, job creation, health and education, positioning the commercial sector as a key driver of economic growth. The findings align with global research, reinforcing the idea that effective transport networks are essential for fostering productivity and facilitating trade. Moreover, the positive statistical significance of various socio-economic indicators at significance level of .000* highlights the necessity for strategic planning in future transport investments.
Abbreviations
AGSD | Agricultural Sector Development |
CDP | Council Development Plan |
COMSD | Commercial Sector Development |
EDSD | Educational Sector Development |
FAMD | Farm road Development |
GDP | Gross Domestic Product |
GESP | Growth and Employment Strategic Paper |
GTRI | Growth in Transport Infrastructure |
HOSD | Hospital Sector Development |
INSD | Industrial Sector Development |
MAC | Market Accessibility |
OECD | Organization for Economic Co-operation and Development |
UHD | Urban Housing Development |
TIGM | Transport Infrastructure Growth Model |
TOSD | Tourism Sector Development |
Conflicts of Interest
The authors declare no conflicts of interest.
References
| [1] |
ADBGC-African Development Bank Group of Cameroon, (2018). Transport Sector Support Programme Phase III- Construction of the Ring Road. Summary of the Resettlement Action Plan for Project Affected Persons.
|
| [2] |
Apostolopoulos, Y., & Sonmez, S. (2006). Tracing the diffusion of infectious diseases in the transport sector population mobility and infectious disease.
https://www.researchgate.net/publication/226568159
|
| [3] |
Aschauer, D. A., (1989). Is public expenditure productive? J. Monetary Econ. 23(2), 177-200.
|
| [4] |
Arvin, M. B.; Pradhan, R. P.; Norman, N. R., (2015). Transportation intensity, urbanization, economic growth, and CO2 emissions in the g-20 countries. Util. Policy, 35, 50-66.
|
| [5] |
Banerjee, A., Duflo, E., & Qian, N. (2012). On the road: Access to transportation infrastructure and economic growth in China (No. w17897). Cambridge, MA: National Bureau of Economic Research.
|
| [6] |
Barro, R. J. (1988). "Government Spending In a Simple Model Of Endogenous Growth." National Bureau of Economic Research Working Paper No. 2588.
|
| [7] |
Boisjoly, G., Serra, B., Oliveira, G., & El-Geneidy, A. (2020). Inequity in transit: Evaluating public transport distribution through accessibility measurements in São Paulo, Rio de Janeiro, Curitiba and Recife, Brazil. Journal of Transport Geography, 82, 1-11.
|
| [8] |
Caroline Dominguez, & Vivian Foster. (2011). Cameroon’s Infrastructure: A continental perspective. In Africa Infrastructure Country Diagnostic country Report (p. 59).
|
| [9] |
Claudia B., Uwe D. Harris S., (2015). How roads support development. World Bank Blog.
|
| [10] |
Claudia N. B., Uwe D., Yishen L., & Harris S., (2017). Transport Policies and Development. The Journal of Development Studies, Vol. 53, No. 4, 465-480,
http://dx.doi.org/10.1080/002
|
| [11] |
Damania, R., & Wheeler, D. (2018). Road improvement and deforestation in the Congo Basin Countries (World Bank Policy Research Working Paper, WPS 7274). Washington, DC: The World Bank.
|
| [12] |
European Economic and Social Committee and the Committee of the Regions EESC & CR, (2020). Sustainable and Smart Mobility Strategy - putting European transport on track for the future (SWD (2020) 331 final). Retrieved from EUR-Lex - 52020DC0789 - EN - EUR-Lex (europa.eu).
|
| [13] |
Fan S and Chan-Kang C (2008). Regional road development, rural and urban poverty: Evidence from China Transport Policy 15 305-14.
|
| [14] |
Francois, T., (2005). Institutions and systems: Analysing technical innovation processes from an institutional perspective, pp. 23-48.
|
| [15] |
Fofiri Nzossie. (2012). Les infrastructures routières comme facteur de (re) configuration de l’espace marchands. In Cahiers de l’Afrique de l’Quest, Peuplement, marche et sécurité alimantaire, pp. 125-127.
|
| [16] |
Fogwe, Z., & Ntumngia, L. (2015). Road Infrastructural Development and Traffic Patterns in Bamenda: A Cameroonian Medium City. Journal of Progressive Research in Social Sciences, Vol 3(1), 134-145.
http://www.scitecresearch.com/journals/index.php/jprss/
|
| [17] |
Foster, V., & Briceño-Garmendia, C. (2010). Africa's infrastructure: A time for transformation. Washington, DC: Agence Française de Développement.
|
| [18] |
Fourie, J., (2006). Economic infrastructure: a review of definitions, theory and empirics. S. Afr. J. Econ. 74(3), 530-556.
|
| [19] |
Gillen, W., (2009). What are the “ingredients” for economic growth? New York: Seabury Press.
|
| [20] |
Gunasekera K, Anderson W and Lakshmanan T R (2008). Highway-induced development: evidence from Sri Lanka World Development 36(11) 2371-89.
|
| [21] |
Handy S. (2008). Regional transportation planning in the US: An examination of changes in technical aspects of the planning process in response to changing goals, Transport Policy, vol. 15, pp. 113-126.
|
| [22] |
Hasselgren, B., (2018). Transport Infrastructure in Time, Scope and Scale: an Economic History and Evolutionary Perspective. Springer International Publishing AG, Switzerland.
|
| [23] |
Heintz, J., Pollin, R., Garrett-Peltier, H., (2009). How Infrastructure Investments Support the US Economy: Employment, Productivity and Growth. Political Economy Research Institute, University of Massachussetts Amberst, Massachussetts.
|
| [24] |
Ive, G., Gruneberg, S. L., (2000). The Economics of the Modern Construction Sector. Macmillan, Basingstoke.
|
| [25] |
Jeyaranjan, J., Harriss, J., & Nagaraj, K. (2010). Land, labour and caste politics in rural Tamil Nadu in the 20th centrury: Iruvelpattu (1916-2008). Economic & Political Weekly, 45(31).
https://www.epw.in/search/site/john%20harris?
|
| [26] |
Khadaroo, J. (2015). The role of transport infrastructure in FDI: Evidence from Africa using GMM estimates (January).
|
| [27] |
Marie, G., Boris, N., & Gael, R. (2009). The impact of roads on poverty reduction: A case study of Cameroon (p. 34).
|
| [28] |
Meersman, H., Nazemzadeh, M., (2017). The contribution of transport infrastructure to economic activity: the case of Belgium. Case Stud. Transport Pol. 5(2), 316-324.
|
| [29] |
Mehmood Alam, K. (2017). Efficiency evaluation of Pakistan Railways using data envelopment analysis. Civil and Environmental Research, 9(4).
|
| [30] |
Munnell, A. H., (1992). Policy watch: infrastructure investment and economic growth. J. Econ. Perspect. 6(4), 189-198.
|
| [31] |
OECD (2002). Impact of Transport Infrastructure Investment on Regional Development. Organisation For Economic Co-Operation and Development,
https://www.itf-oecd.org
|
| [32] |
Pisu, M., Pels, B., Bottini, N., (2015). Improving Infrastructure in the United Kingdom. [OECD Economics Department Working Papers No. 1244. OECD Publishing.
https://doi.org/10.1787/5jrxqbqc7m0p-en
|
| [33] |
Pojani, D., & Stead, D. (2015). Sustainable urban transport in the developing world: beyond megacities. Sustainability, 7, 7784-7805.
https://doi.org/10.3390/su7067784
|
| [34] |
Polyzos S. & Tsiotas D., (2020). The Contribution of Transport Infrastructures to the Economic and Regional Development: A Review of the Conceptual Framework. Theoretical and Empirical Researches in Urban Management, Vol. 15, Issue 1.
|
| [35] |
Pradhan, R. P.; Bagchi, T. P., (2013). Effect of transportation infrastructure on economic growth in India: The VECM approach. Res. Transp. Econ., 38, 139-148.
|
| [36] |
Pravakar S., Ranjan K. D., and Geethanjali N., (2010). Infrastructure Development and Economic Growth in China. Institute of Developing Economies, JETRO.
|
| [37] |
Sahoo, Pravakar, and Ranjan Kumar Dash., (2012). Economic Growth in South Asia: Role of Infrastructure. The Journal of International Trade & Economic Development 21: 217-52.
|
| [38] |
Schwab, K., (2014). The Global Competitiveness Report 2014-2015 [Insight Report]. World Economic Forum. A
http://www3.weforum.org/docs/WEFGlobalCompetitivenessReport_2014-15.pdf
|
| [39] |
Sedar, F. P. (2007) Infrastructure and Economic Growth: The Role of Infrastructure for Economic Growth in Africa: Case Study of Cote d’ Ivoire. Research paper for GECO 6203: Advance Macroeconomics ll. New School University, New School for Social Research. New York.
|
| [40] |
Sharma, Keshab K., Netra P. B., Mandip S., and Rojee P., (2024). Unraveling the Nexus between Road Transport Infrastructures and Economic Growth: Empirical Insights from Nepal’s Case. Economies 12: 221.
https://doi.org/10.3390/economies12080221
|
| [41] |
Teravaninthorn, S., & Raballand, G. (2008). Transport prices and costs in Africa: A review of the main international corridors. Washington, DC: World Bank.
|
| [42] |
Thacker, S., Adshead, D., Fay, M., Hallegatte, S., Harvey, M., Meller, H., et al., (2019). Infrastructure for sustainable development. Nature Sustainability, 2, 324-331.
|
| [43] |
Torrisi, G., (2009). Public infrastructure: definition, classification and measurement issues. Econ. Manag. Financ. Mark. 4(3), 100-124.
|
| [44] |
Tsiotas, D., Polyzos, S., (2018). “The complexity in the study of spatial networks: an epistemological approach”, Networks and Spatial Economics, 18(1), pp. 1-32.
|
| [45] |
World Bank (2020). Global status report on road safety: Summary. World Health Organization (WHO/NMH/NVI/).
https://www.who.int/violence_injury_prevention/road_safety_status/ 2018/GSRRS2018_Summary_EN.pdf
|
| [46] |
Xie, F., Levinson, D., (2009). Modeling the Growth of Transportation Networks: A Comprehensive Review. Netw Spat Econ 9, 291-30.
https://doi.org/10.1007/s11067-007-9037-4
|
| [47] |
Yu, Haowei and Zhou, (2021). You, Highway Spending and Induced Vehicle Emissions: Evidence from the US States. Resource and Energy Economics, Forthcoming, Available at SSRN:
http://dx.doi.org/10.2139/ssrn.3763248
|
Cite This Article
-
APA Style
Temgoua, N. Y., Chianebeng, J. K., Guepi, S. F. (2025). Transport Investment and Regional Economic Growth: An Economic Role of Transportation Infrastructure Development in Bafoussam City, Cameroon. International Journal of Sustainable Development Research, 11(3), 152-165. https://doi.org/10.11648/j.ijsdr.20251103.12
 Copy
|
Copy
|
 Download
ACS Style
Temgoua, N. Y.; Chianebeng, J. K.; Guepi, S. F. Transport Investment and Regional Economic Growth: An Economic Role of Transportation Infrastructure Development in Bafoussam City, Cameroon. Int. J. Sustain. Dev. Res. 2025, 11(3), 152-165. doi: 10.11648/j.ijsdr.20251103.12
Copy
|
Download
AMA Style
Temgoua NY, Chianebeng JK, Guepi SF. Transport Investment and Regional Economic Growth: An Economic Role of Transportation Infrastructure Development in Bafoussam City, Cameroon. Int J Sustain Dev Res. 2025;11(3):152-165. doi: 10.11648/j.ijsdr.20251103.12
Copy
|
Download
-
@article{10.11648/j.ijsdr.20251103.12,
  author = {Nadine Yemelong Temgoua and Japhet Kuma Chianebeng and Sephora Fozang Guepi},
  title = {Transport Investment and Regional Economic Growth: An Economic Role of Transportation Infrastructure Development in Bafoussam City, Cameroon
},
  journal = {International Journal of Sustainable Development Research},
  volume = {11},
  number = {3},
  pages = {152-165},
  doi = {10.11648/j.ijsdr.20251103.12},
  url = {https://doi.org/10.11648/j.ijsdr.20251103.12},
  eprint = {https://article.sciencepublishinggroup.com/pdf/10.11648.j.ijsdr.20251103.12},
  abstract = {In their struggle to alleviate poverty, most Sub-Sahara African governments have credited transport infrastructure development as one of the most promising development indicator to achieve this goal. In Cameroon, investment in transport infrastructure is paving the way for timely delivery of local food from rural areas to urban centers, generating employment opportunities, enhancing living standards for low-and middle-income families, and improving access to healthcare and educational facilities, while also increasing savings rates. This paper explores this transportation investments on the economic development of Bafoussam city. It focuses on three key aspects: (i) the trends in transport infrastructure development in Bafoussam, (ii) the inter-connected economic impacts of these transport developments, and (iii) recommendation for future transport investments for sustainable economic growth. Socio-Economic Growth Indicators were employed to construct a comprehensive assessment of transport infrastructure investment in the study area. To access the trends in transport development, an ex-post facto research design using time series data for 2000-2010-2020 was projected and correlated with socio-economic development indicators. Qualitative data were sourced from key informants particularly household heads (n = 147), city authorities (n = 4), and focus group discussions (n = 5), enabling a nuanced inferential analysis and interpretation of the result. The empirical data collected set the groundwork for policy recommendations aimed at promoting sustainable transport investment while fostering economic growth. The outcome of the study shows that road transport investments have significantly increased over time in Bafoussam. The findings records significant socio-economic contribution as a result of transport investment. The regression analysis of the interconnected impacts of transport investment on various socio-economic development variables indicated a perfect correlation coefficient of 1.00*, with calculated p-values of .000*. While socio-economic growth factors such as employment, income, trade, education, and healthcare facilities appear to be improving, variations exist based on location and social class within the Bafoussam urban area. This suggests the need for combined place-based and people-centered policies to effectively address the impacts of road infrastructure projects.
},
 year = {2025}
}
Copy
|
Download
-
TY  - JOUR
T1  - Transport Investment and Regional Economic Growth: An Economic Role of Transportation Infrastructure Development in Bafoussam City, Cameroon

AU  - Nadine Yemelong Temgoua
AU  - Japhet Kuma Chianebeng
AU  - Sephora Fozang Guepi
Y1  - 2025/07/09
PY  - 2025
N1  - https://doi.org/10.11648/j.ijsdr.20251103.12
DO  - 10.11648/j.ijsdr.20251103.12
T2  - International Journal of Sustainable Development Research
JF  - International Journal of Sustainable Development Research
JO  - International Journal of Sustainable Development Research
SP  - 152
EP  - 165
PB  - Science Publishing Group
SN  - 2575-1832
UR  - https://doi.org/10.11648/j.ijsdr.20251103.12
AB  - In their struggle to alleviate poverty, most Sub-Sahara African governments have credited transport infrastructure development as one of the most promising development indicator to achieve this goal. In Cameroon, investment in transport infrastructure is paving the way for timely delivery of local food from rural areas to urban centers, generating employment opportunities, enhancing living standards for low-and middle-income families, and improving access to healthcare and educational facilities, while also increasing savings rates. This paper explores this transportation investments on the economic development of Bafoussam city. It focuses on three key aspects: (i) the trends in transport infrastructure development in Bafoussam, (ii) the inter-connected economic impacts of these transport developments, and (iii) recommendation for future transport investments for sustainable economic growth. Socio-Economic Growth Indicators were employed to construct a comprehensive assessment of transport infrastructure investment in the study area. To access the trends in transport development, an ex-post facto research design using time series data for 2000-2010-2020 was projected and correlated with socio-economic development indicators. Qualitative data were sourced from key informants particularly household heads (n = 147), city authorities (n = 4), and focus group discussions (n = 5), enabling a nuanced inferential analysis and interpretation of the result. The empirical data collected set the groundwork for policy recommendations aimed at promoting sustainable transport investment while fostering economic growth. The outcome of the study shows that road transport investments have significantly increased over time in Bafoussam. The findings records significant socio-economic contribution as a result of transport investment. The regression analysis of the interconnected impacts of transport investment on various socio-economic development variables indicated a perfect correlation coefficient of 1.00*, with calculated p-values of .000*. While socio-economic growth factors such as employment, income, trade, education, and healthcare facilities appear to be improving, variations exist based on location and social class within the Bafoussam urban area. This suggests the need for combined place-based and people-centered policies to effectively address the impacts of road infrastructure projects.

VL  - 11
IS  - 3
ER  -
Copy
|
Download